The following information is taken from the 2022 Micon Feasibility Report (FS). This report focuses on the Main Zone oxide mineral resources at the Candelones project.
Mining
The oxide resources that are the subject of the 2022 feasibility are located close to the surface and would be mined by open pit methods over an operating period of slightly more than three years.
The operations will consist of a conventional open pit truck and shovel. The oxide material is friable and relatively soft and can be removed by ripping with no drilling and blasting activities designed. The open pit will be fully operated by a contractor, while Unigold will remain responsible for sourcing the aggregates for construction.
Ore material will be sent to either the heap leach facility or an ore stockpile; the stockpile will serve as complement to feed the leach pad during periods of low pit-production in the rainy season (August to October). Waste material will be sent to the waste dump storage (WDS) located southeast of the pit.
The mine will operate 360 days per year, with five days for scheduled maintenance and down-time. Mining will be carried out during a single twelve-hour shift per day. The mining of the pit will be divided into six pushbacks during the 3.3 years of operation and be executed in 5 m benches.
A mining rate of 5,000 t/d has been selected and this would result in a life-of-mine of approximately 3.3 years (39 months). The ramp-up period occurs over the first two months, followed by 36 months of mining at peak capacity, and the last month of post-peak production ramping down. The target peak mining rate is 150 kt/month (5,000 t/d); however, this production rate has been adjusted to reflect the rainy season that occurs during the months of August through October.
The mining dilution has been assessed by considering the nature of the operation. Given that no drilling/blasting activity is planned and given the relatively small size of equipment, an estimate of 2.5% has been made for the mining dilution (0.25 m over 10 m block). The size of the equipment and the bench height also allow for a estimated minimal ore loss of 2.5%.
On average there are two active mining areas within the pit to provide flexibility during the rainy months.
Processing
From the Candelones Main and Connector open pit areas, approximately 5,000 t/d of oxide mineralization will be mined and then transported into the heap leach pad area. The material fed to the leaching process will be coarse screened to remove competent rock from the more friable fine fraction. The heap leach pad will be irrigated with a barren leach solution (BLS) containing up to 1,000 ppm of NaCN and lime to ensure that suitably high solution pH is present in the leachate after leaching. Gold dissolution is expected to be relatively rapid and to reach 89% of the contained gold extraction after 90 days of leaching. A portion of silver will be recovered as well although this is excluded from the financial model.
Pregnant leach solution (PLS), the main product of the leaching process, will be pumped from the main PLS pond to the feed tank of the carbon-in-columns (CIC) circuit. The PLS solution will be contacted in a counter current process with activated carbon to adsorb the dissolved previous metals. The loaded carbon from the CIC circuit will then report to an adsorption, desorption and regeneration (ADR) plant, comprising acid wash, elution, carbon preparation – regeneration and disposal, electrowinning cells and a refinery to produce Doré bars.
The predicted precious metal dissolutions and reagent consumptions were determined from column leach testwork carried out by Bureau Veritas Commodities Canada Ltd., Vancouver. The process design criteria are based on the analysis of the metallurgical test data including bottle roll testing with a focus on column leach test results.
Material that is below economic cut-off (“waste") will be stored in a conventional Waste Rock Dump (WRD). A Tailings Storage Facility (TSF) will not be required for the Project due to the nature of the heap leach process and Adsorption Desorption Recovery (ADR) method used.
Infrastructure
The infrastructure included in the feasibility includes the following:
- Heap leach facility
- Waste rock storage
- Access and Site roads.
- On-site power generation and site electrical distribution system.
- Bore holes, pumps and piping for site fresh water supply.
- Process solution ponds.
- Process facility buildings, including control room and secure gold room.
- Modular units for administration, offices, dry, lunchroom, first aid building and security gate.
Capital and Operating Costs
The expected accuracy of the feasibility study capital and operating estimates is ±15%. The estimates are expressed in third quarter 2022 United States dollars, without provision for escalation. Where appropriate, an exchange rate of DOP 54/US$ has been applied.
| Item |
Initial Capital
US$’000 |
Sustaining Capital
US$’000 |
LOM Total
US$’000 |
| Mining |
1,708 |
935 |
2,643 |
| Processing Plant |
9,972 |
- |
9,972 |
| Infrastructure |
16,420 |
- |
16,420 |
| EPCM, Indirect |
1,825 |
- |
1,825 |
| Owners Costs |
1,896 |
- |
1,896 |
| Sub-total before contingencies |
31,822 |
935 |
32,757 |
| Contingencies |
4,099 |
- |
4,099 |
| Grand total Capital |
35,922 |
935 |
36,857 |
| Closure and Rehabilitation |
466 |
4,663 |
5,129 |
Operating costs were estimated based on similar operations with some modifications to reflect the contractor costs for the oxides obtained by Unigold. It is Micon’s QP’s opinion that the costs are reasonable, but they were not developed from first principles and are considered conceptual in nature.
| Parameters |
LOM Total $’000 |
$/t Treated |
US$/oz Au |
| Mining costs |
23,107 |
4.13 |
224 |
| Processing costs |
31,056 |
5.55 |
302 |
| General & Administrative costs |
7,316 |
1.31 |
71 |
| Subtotal Cash Operating Costs |
61,479 |
10.98 |
597 |
| Selling expenses incl. Royalty |
17,826 |
3.18 |
173 |
| Total Cash Cost |
79,305 |
14.17 |
770 |
Feasibility Economic Analysis
Basis of Evaluation
Micon prepared its assessment of the Project on the basis of a discounted cash flow model, from which the Internal Rate of Return (IRR) and Net Present Value (NPV) can be determined. Assessments of NPV are generally accepted within the mining industry as representing the economic value of a project after allowing for the cost of capital invested.
Exchange Rate and Inflation
All results are expressed in United States dollars, except where otherwise stated. Cost estimates and other inputs to the cash flow model for the Project have been prepared using constant, third quarter 2022 money terms, i.e., without provision for escalation or inflation.
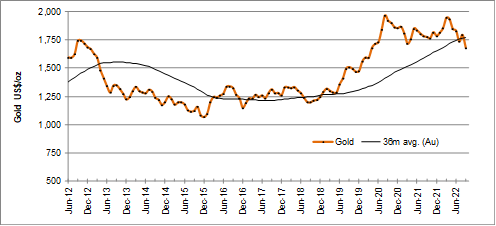
Expected Metal Prices
Project revenues will be generated from the sale of gold doré bars. The Project has been evaluated using a constant metal price of US$1,650/oz Au. This is close to current market levels and below the average achieved over the 36 months ending 30 September, 2022. The following chart shows monthly average prices for gold over the past ten years, along with the 36-month trailing average price over that period.
Taxation and Royalty Regime
Dominican Republic provincial income and mining taxes have been provided for in the economic evaluation. There is a 5% royalty on gold sales payable to the Government of the Dominican Republic. The amount paid to the Government under this royalty forms a minimum tax and is credited against Income tax payable. Should income tax payable be lower than the royalty paid, no refund of the royalty amount is allowed. Depreciation of capital costs is allowed on a unit of production basis, and income tax is levied at the rate of 27% on net earnings. Unigold is also subject to a levy of 5% of after-tax income payable to support local community projects. According to Unigold’s public disclosure there is also an outstanding option held by a third party to acquire a 2% revenue royalty over the project.
Micon has applied a 10% royalty on revenue in order to account for the various tax and community burdens, and also applied a 27% tax on remaining income in the economic analysis presented for this study.
Technical Assumptions
The technical parameters, production forecasts and estimates summarized below and described in detail within the feasibility study are reflected in the base case cash flow model. The assumptions and estimates are provided below.
Production Schedule
Annual tonnages of waste rock and material heaped on the leach pad, the average ore grade, stripping ratio and the gold content of the material to be leached are shown in the following figure.
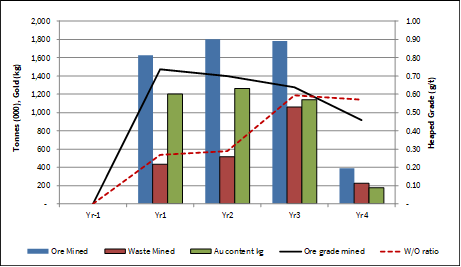
Heap leach extraction of gold has been modelled assuming 88.0% recovery from oxide material and 58.9% from the transition zone, for a weighted average recovery of 84.9% (Figure 1.4). Notwithstanding column testwork showing more rapid leaching, the cash flow model assumes full recovery of the leachable gold will require 3 months from placement of material on the heap.
A further 7 days of sales is provided in working capital for accounts receivable. Stores and accounts payable are provided for with 45 and 30 days, respectively.
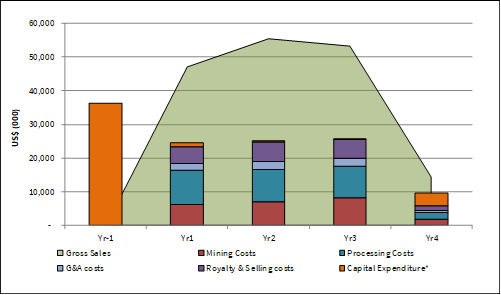
Operating Margin
The following figure shows the annual sales revenues compared to capital expenditure and cash operating costs. The Project is forecast to generate an average operating margin of 53% over the LOM period.
Project Cash Flow
At $1650/oz, pre-tax cash flows provide an internal rate of return (IRR) of 52.4%; when discounted at the rate of 5% per year, the pre-tax net present value (NPV5) is $38.2 million. The payback period is approximately 1.5 years.
At $1650/oz, after-tax cash flows provide an IRR of 43.6%; after-tax NPV5 is $30.6 million. Profitability index (i.e., the ratio of NPV5/Initial Capital) is 0.9. The after-tax payback period is 1.6 years.
| Period |
Units |
LOM Total |
Yr-1 |
Yr1 |
Yr2 |
Yr3 |
Yr4 |
| Tonnes treated (t'000) |
t'000 |
5,597 |
- |
1,612 |
1,800 |
1,799 |
387 |
| Heaped Grade |
g/t Au |
0.67 |
- |
0.74 |
0.70 |
0.64 |
0.46 |
| Gold Content |
koz Au |
121.35 |
- |
38.23 |
40.44 |
36.98 |
5.70 |
| Gold Sales (payable oz) |
koz Au |
102.97 |
- |
28.47 |
33.54 |
32.27 |
8.69 |
| |
|
|
|
|
|
|
|
| Gross revenue |
$'000 |
169,894 |
- |
46,970 |
55,342 |
53,252 |
14,331 |
| |
|
|
|
|
|
|
|
| Mining |
$'000 |
23,107 |
- |
6,190 |
7,052 |
8,109 |
1,757 |
| Processing |
$'000 |
31,056 |
- |
10,064 |
9,538 |
9,426 |
2,028 |
| G&A |
$'000 |
7,316 |
- |
2,107 |
2,353 |
2,351 |
506 |
| Cash operating costs |
$'000 |
61,479 |
- |
18,360 |
18,943 |
19,886 |
4,290 |
| Selling costs |
$'000 |
17,826 |
- |
4,930 |
5,807 |
5,584 |
1,504 |
| Total Cash Costs |
$'000 |
79,305 |
- |
23,290 |
24,750 |
25,471 |
5,794 |
| |
|
|
|
|
|
|
|
| Net cash operating margin |
$'000 |
90,589 |
- |
23,680 |
30,592 |
27,781 |
8,537 |
| |
|
|
|
|
|
|
|
| Initial capital |
$'000 |
35,922 |
35,922 |
- |
- |
- |
- |
| Sustaining capital |
$'000 |
935 |
- |
154 |
320 |
260 |
201 |
| Closure provision |
$'000 |
5,129 |
466 |
- |
- |
- |
4,663 |
| Change in working capital |
$'000 |
- |
- |
1,033 |
151 |
(24) |
(1,159) |
| Net Cash flow before tax |
$'000 |
48,603 |
(36,388) |
22,493 |
30,121 |
27,545 |
4,832 |
| Taxation |
$'000 |
8,788 |
- |
2,398 |
3,513 |
2,878 |
- |
| Net Cash flow after tax |
$'000 |
39,815 |
(36,388) |
20,096 |
26,608 |
24,667 |
4,832 |
| |
|
|
|
|
|
|
|
| Disc. cash flow (5%) |
$'000 |
30,637 |
(34,656) |
18,227 |
22,985 |
20,294 |
3,786 |
| Cumulative disc. cash flow |
$'000 |
|
(34,656) |
(16,428) |
6,557 |
26,851 |
30,637 |
| |
|
|
|
|
|
|
|
| |
|
Before Tax |
After Tax |
|
|
|
|
| Internal Rate of Return |
% |
52.4% |
43.6% |
|
|
|
|
| Undiscounted cash flow |
$'000 |
48,603 |
39,815 |
|
|
|
|
| Net Present Value (5%) |
$'000 |
38,214 |
30,637 |
|
|
|
|
| Net Present Value (7.5%) |
$'000 |
33,853 |
26,795 |
|
|
|
|
| Net Present Value (10%) |
$'000 |
29,954 |
23,367 |
|
|
|
|
| |
|
|
|
|
|
|
|
| Total Cash Cost |
US$/oz |
770 |
|
|
|
|
|
| All-in Sustaining Cost |
US$/oz |
829 |
|
|
|
|
|
| All-in Cost |
US$/oz |
1,178 |
|
|
|
|
|
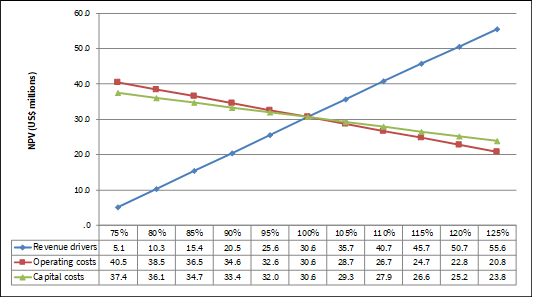
Sensitivity Study and Risk Analysis
Micon tested the sensitivity of the base case after-tax NPV5 to changes in metal price, operating costs and capital investment for a range of 25% above and below base case values. Changes in gold grade and recoveries are equivalent to gold price changes of the same magnitude so these factors can be considered as equivalent to the price sensitivity.
The NPV of the project remains positive on +/- 25% changes to capital, operating cost and gold prices. As is normal in gold projects, NPV is most sensitive to changes in the gold price. The breakeven gold price, given the capital and operating cost assumptions, is about US$1200/oz.